This is a popup dialog that overlays the main content of the page. The popup includes a search form to help you find the information you are seeking. Pressing the close button or using the escape key will close the popup.
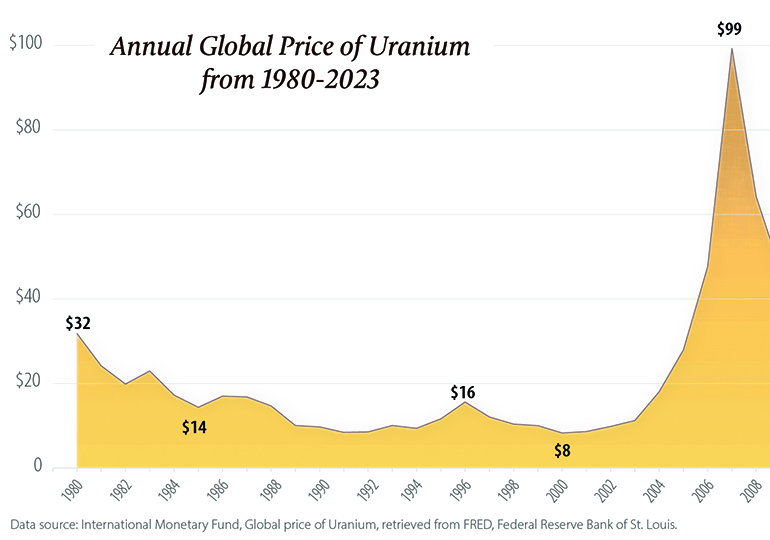
Maps and graphs may be used for non-commercial purposes provided that they are not altered or edited and they are appropriately credited.
All map products should be credited to Stephanie Smith, Grand Canyon Trust, unless otherwise noted. A hyperlink to the Grand Canyon Trust website is appreciated.
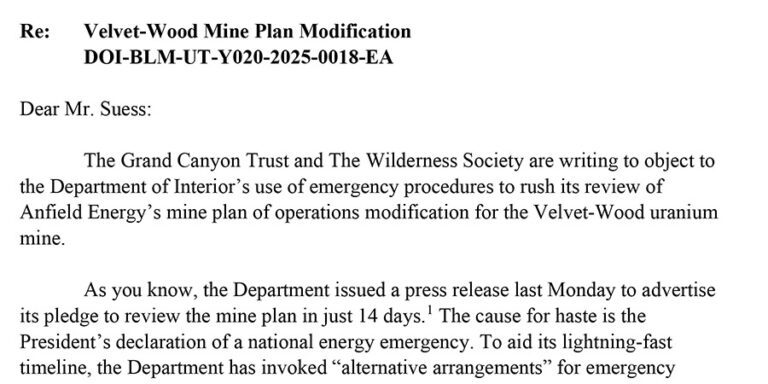
The Grand Canyon Trust’s comments objecting to the Department of Interior’s expedited review of a mine plan modification for the Velvet-Wood uranium mine.
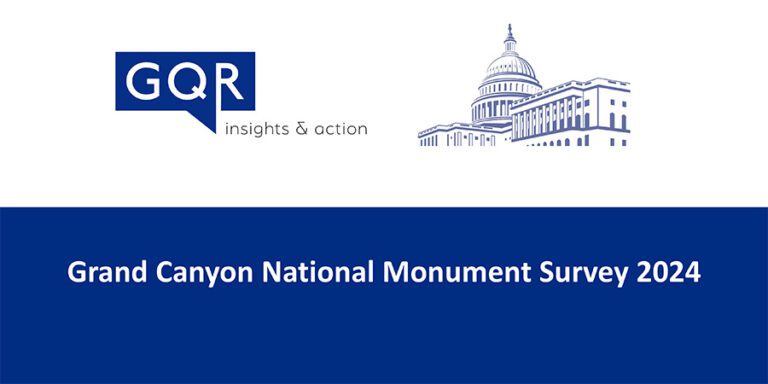
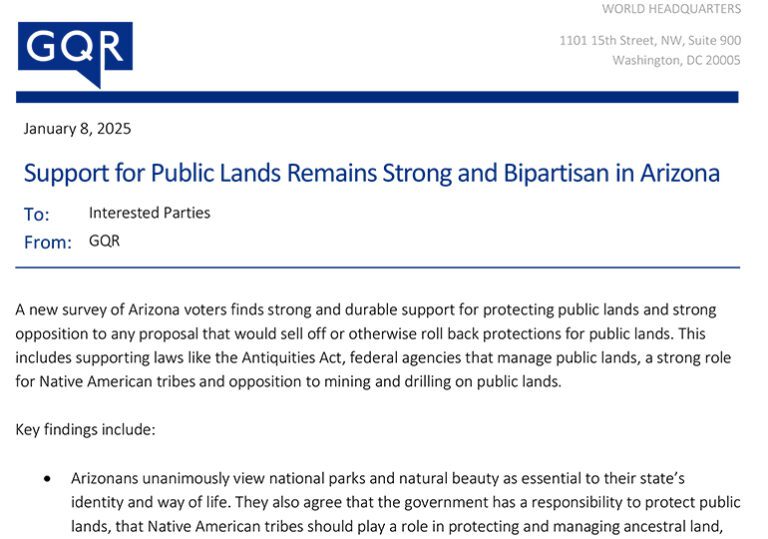
A December 2024 poll of 500 Arizona voters by public opinion research firm GQR found strong public support for Baaj Nwaavjo I’tah Kukveni – Ancestral Footprints of the Grand Canyon National Monument.


