Lake Powell Inflow and Storage Capacity Graph

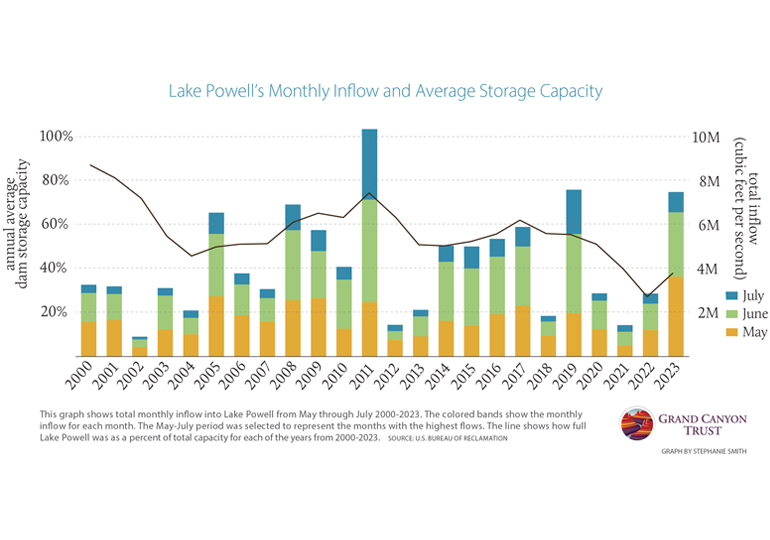
How much water is in Lake Powell? The water level in Lake Powell depends on how much water comes in from river flows, and how much water goes out every year. This graph shows total monthly inflow into Lake Powell for the months of May, June, and July from 2000-2023. The black line shows how full Lake Powell was as a percentage of total capacity.

Lake Powell storage elevation

Download your copy

Maps and graphs may be used for non-commercial purposes provided that they are not altered or edited and they are appropriately credited.

All map products should be credited to Stephanie Smith, Grand Canyon Trust, unless otherwise noted. A hyperlink to the Grand Canyon Trust website is appreciated.

For higher quality images or custom sizing please contact our communications director, Ashley Davidson, at adavidson@grandcanyontrust.org

Related Resources

Dragon Bravo Fire Map showing the locations and burn perimeters of the White Sage and Dragon Bravo wildfires in 2025 near Grand Canyon National Park and Kaibab National Forest, with affected areas shaded in orange.
See a map of the areas the Dragon Bravo and White Sage fires burned on the north rim of the Grand Canyon in the summer of 2025, destroying the lodge and numerous other park buildings.