Lake Powell Levels (1963-2025)

Line graph showing Lake Powell pool elevation from 1963 to 2025, with levels for maximum capacity, power pool, and dead pool marked; elevation drops sharply after 2000.

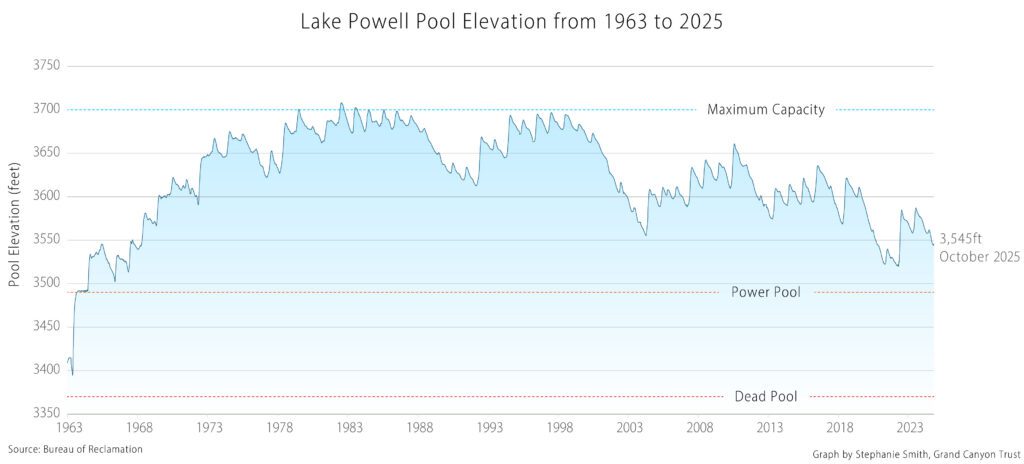
How much has Lake Powell fluctuated since 1963?

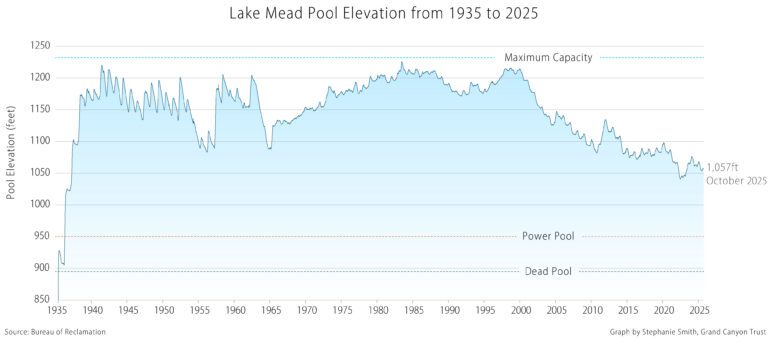
Lake Powell reached its full capacity for the first time in 1980, 17 years after the completion of Glen Canyon Dam. Since 2000, shrinking snowpacks, rising temperatures, thirsty crops, and growing populations have strained the Colorado River and its reservoirs Lake Powell and Lake Mead. See the graph below.

Line graph showing Lake Powell pool elevation from 1963 to 2025, with levels for maximum capacity, power pool, and dead pool marked; elevation drops sharply after 2000.

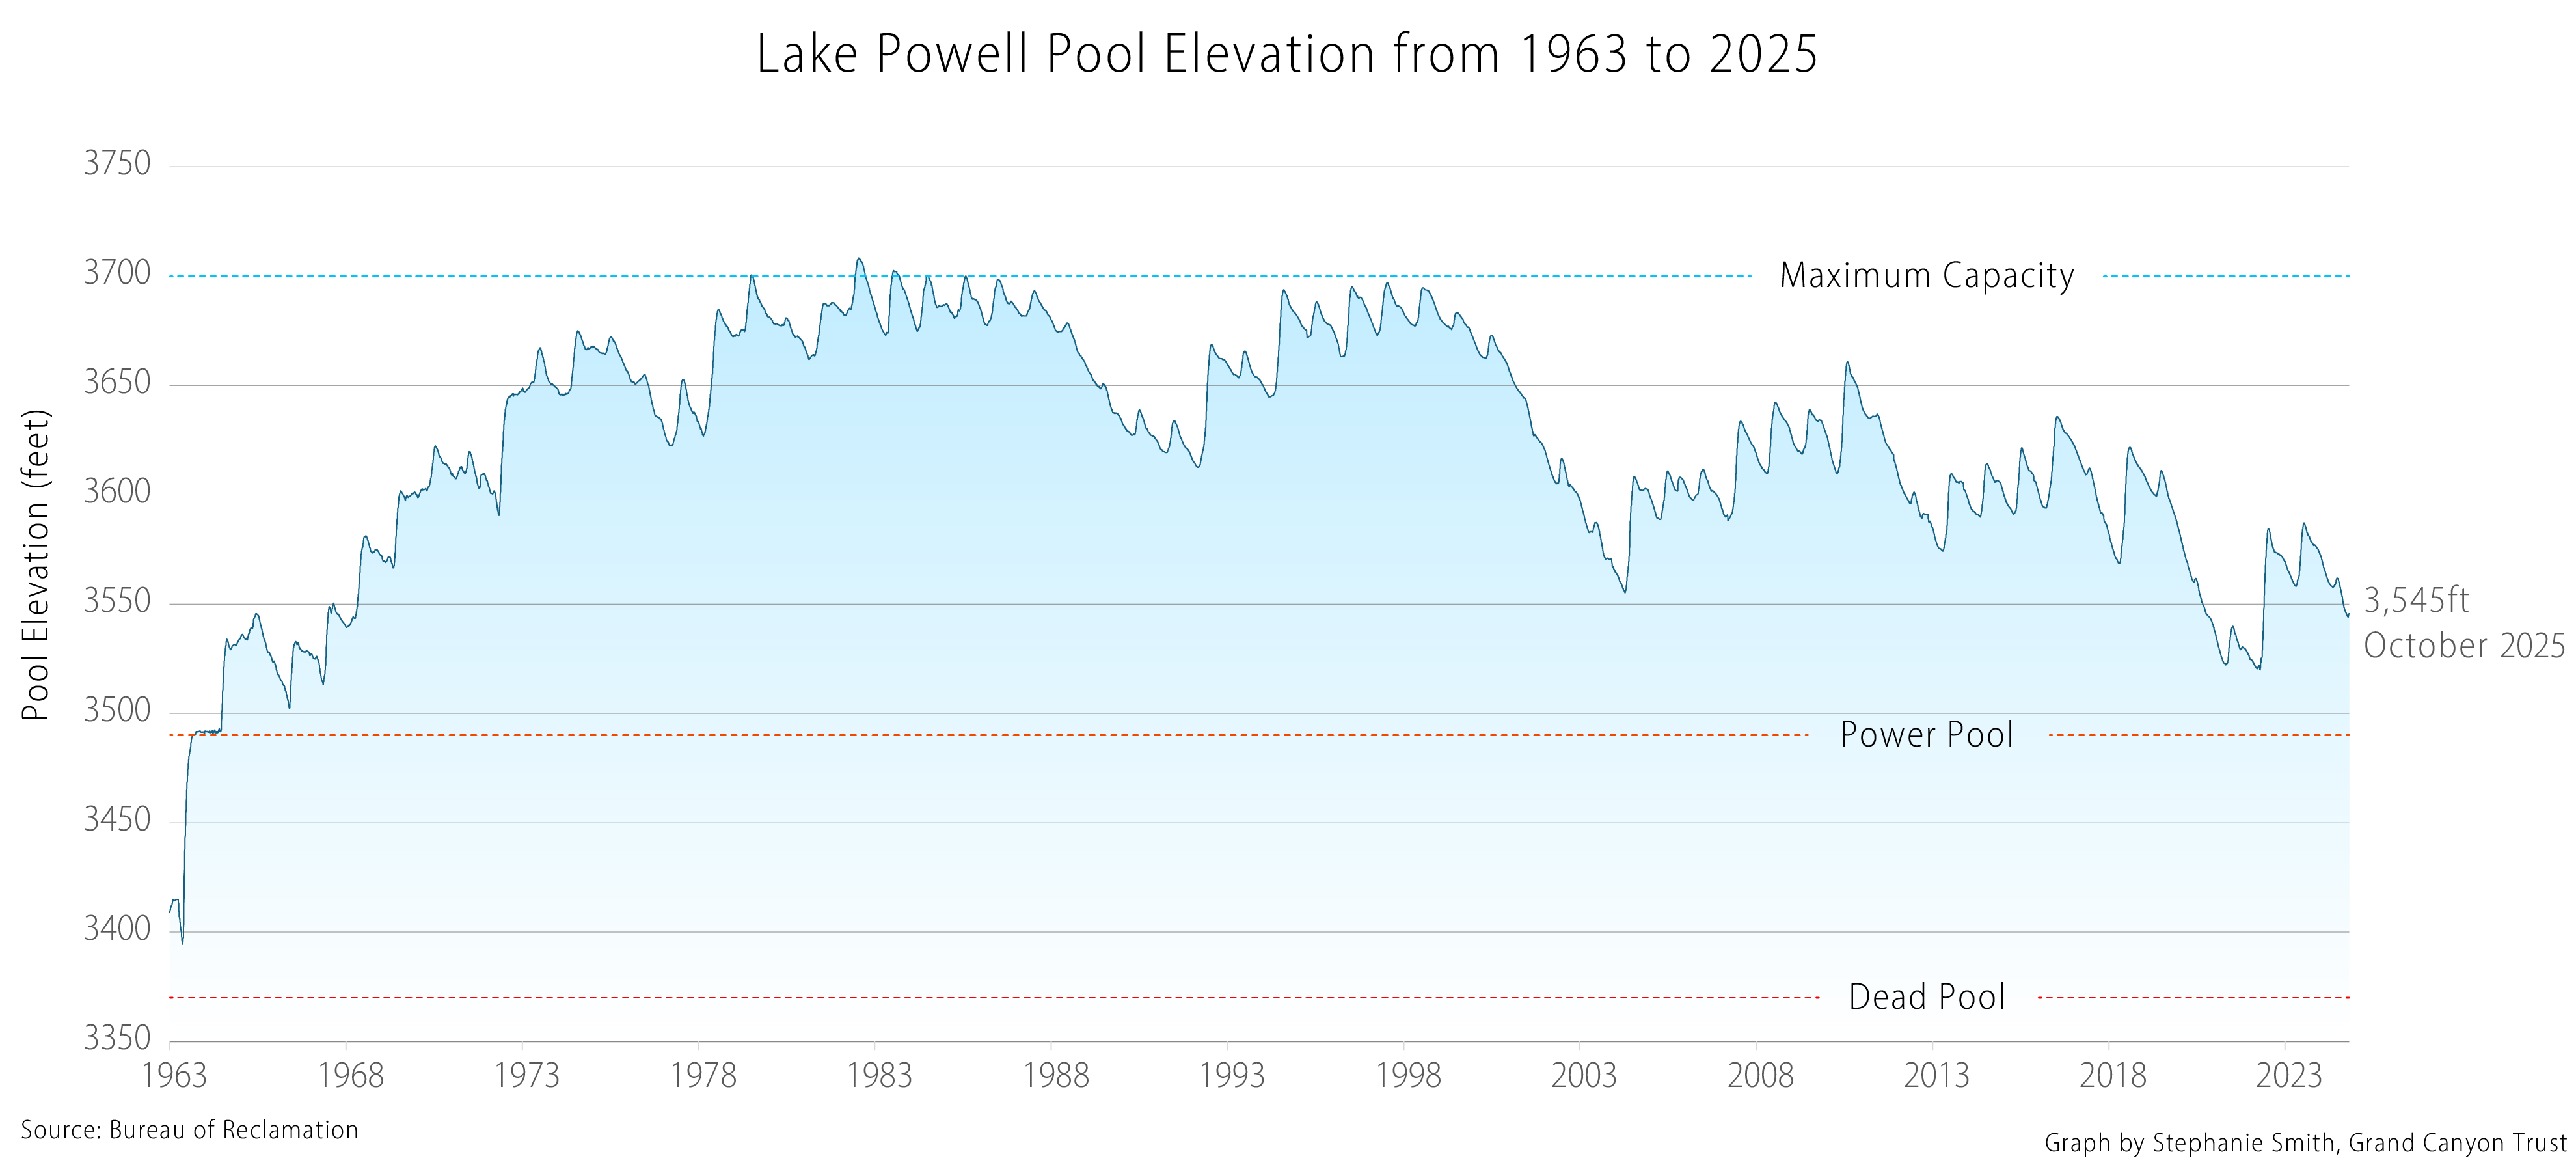
Data source: Bureau of Reclamation

Download your PDF of the graph

Maps and graphs may be used for non-commercial purposes provided that they are not altered or edited and they are appropriately credited.

All map products should be credited to Stephanie Smith, Grand Canyon Trust, unless otherwise noted. A hyperlink to the Grand Canyon Trust website is appreciated.

For higher quality images or custom sizing please contact our communications director, Ashley Davidson, at adavidson@grandcanyontrust.org

Related Resources

Advocate Magazine cover with image of red packraft on clear blue water in a cave in the Grand Canyon
The fall 2025 edition of the Grand Canyon Trust’s Colorado Plateau Advocate magazine, including a deep dive into the Grand Canyon’s ancient groundwater.