This is a popup dialog that overlays the main content of the page. The popup includes a search form to help you find the information you are seeking. Pressing the close button or using the escape key will close the popup.
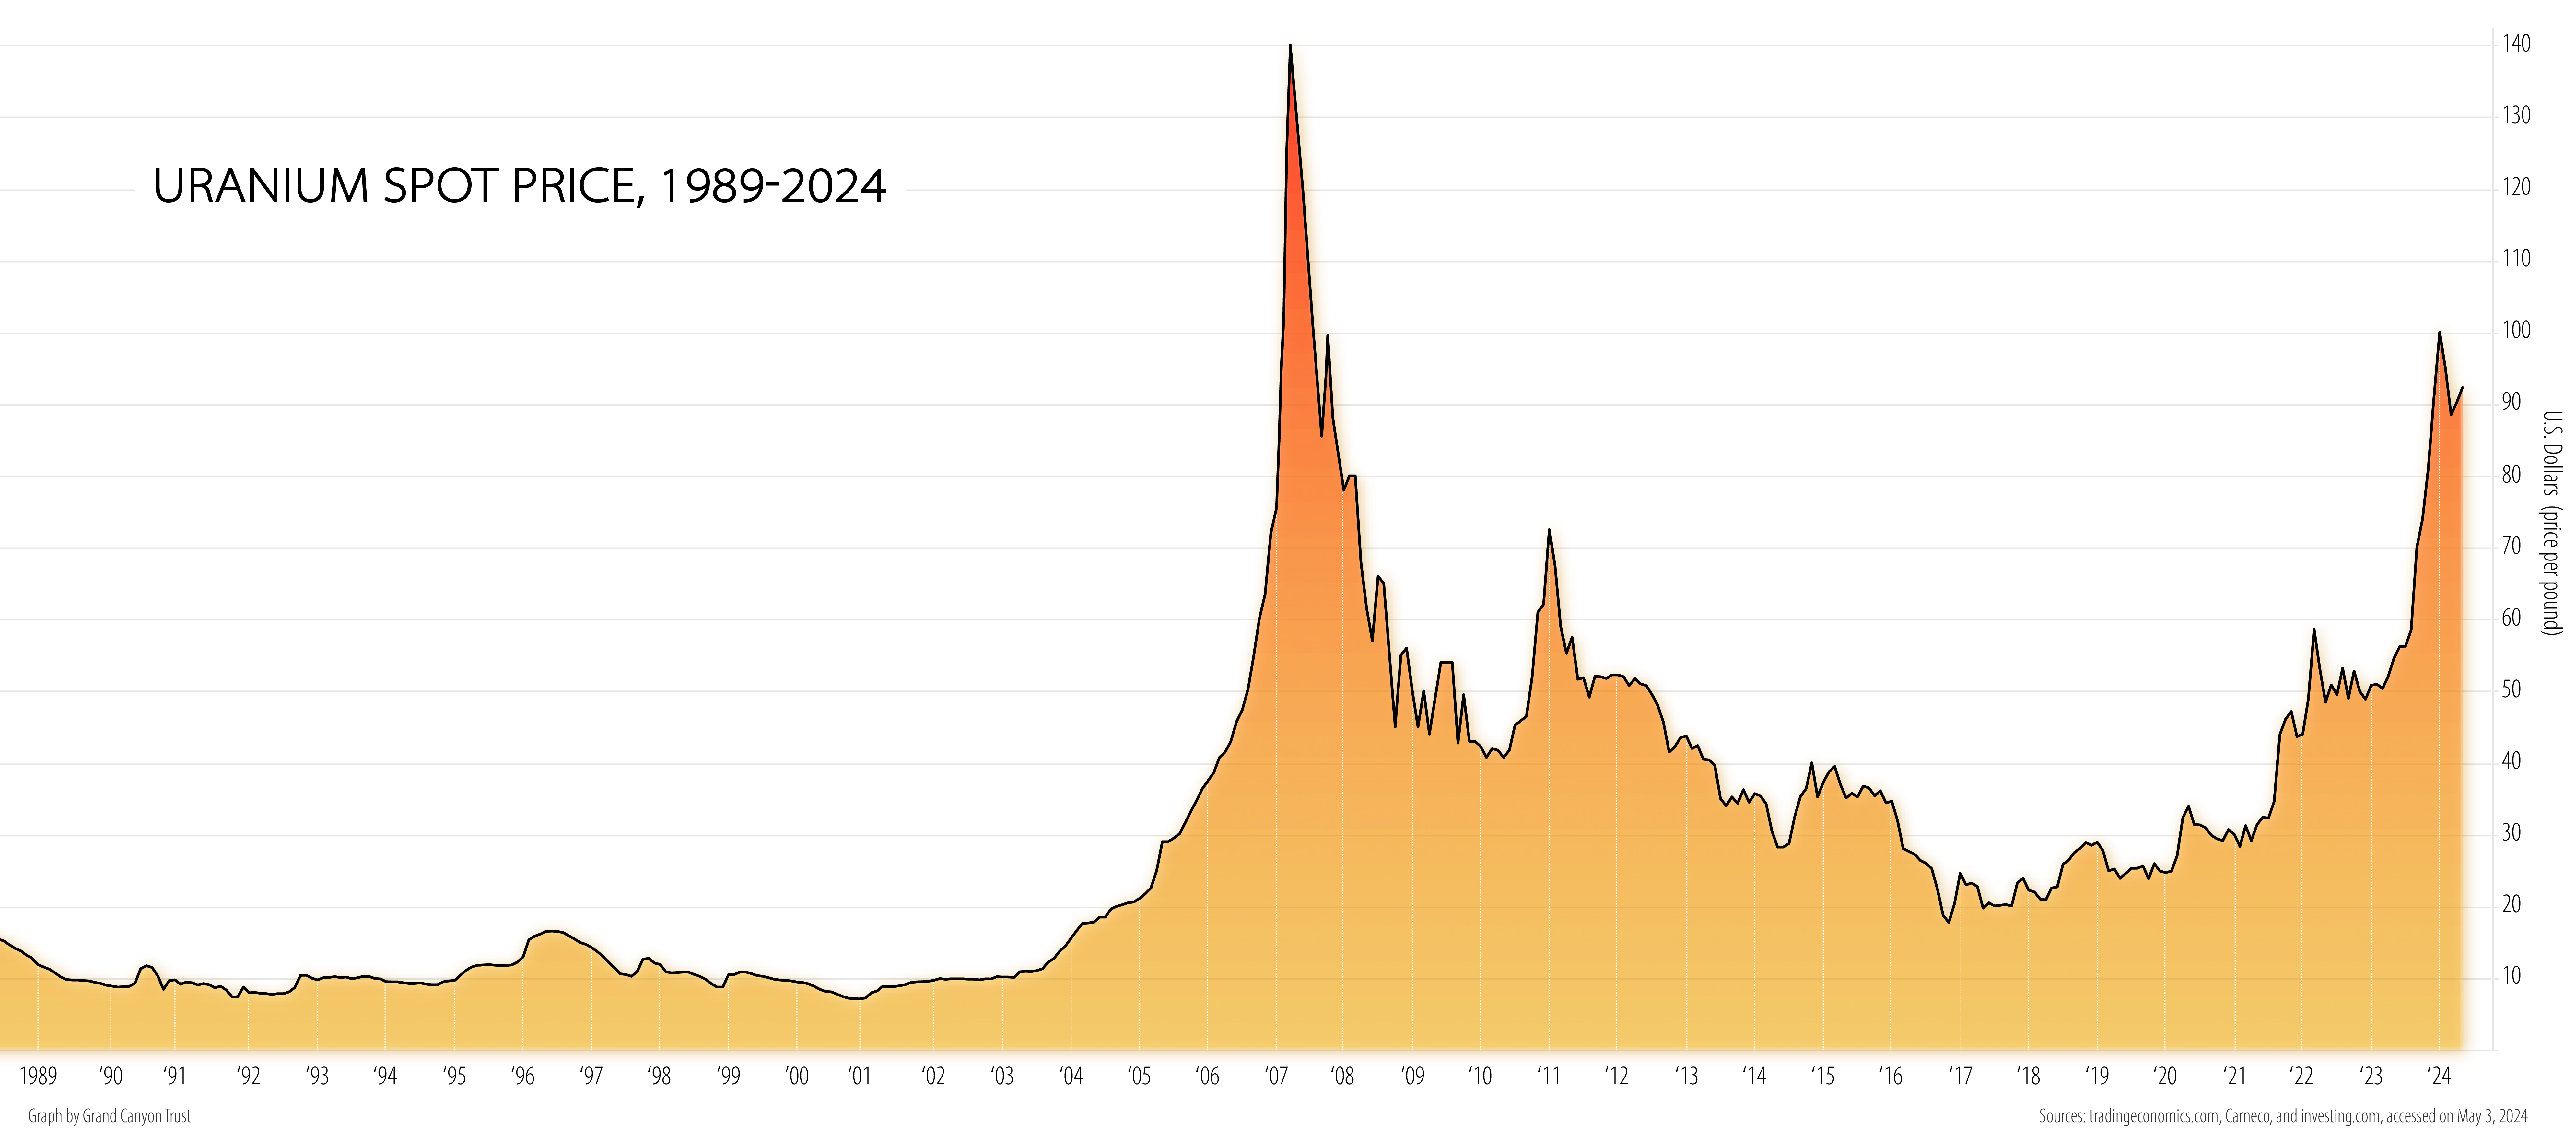
Maps and graphs may be used for non-commercial purposes provided that they are not altered or edited and they are appropriately credited.
All map products should be credited to Stephanie Smith, Grand Canyon Trust, unless otherwise noted. A hyperlink to the Grand Canyon Trust website is appreciated.
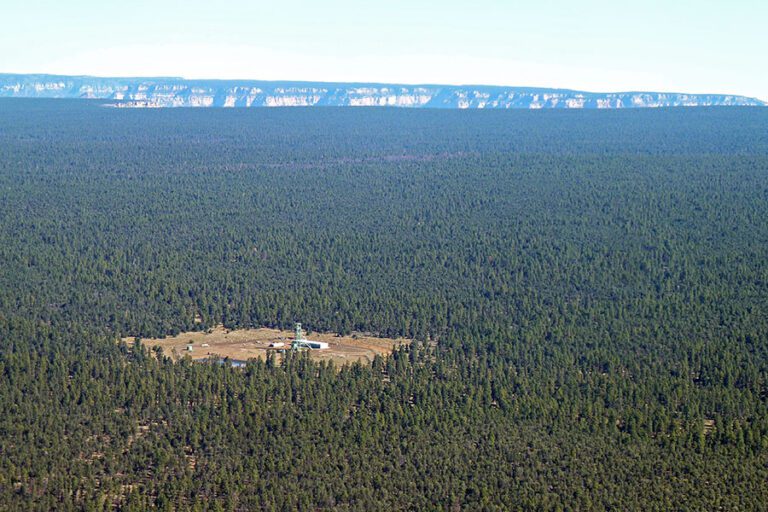
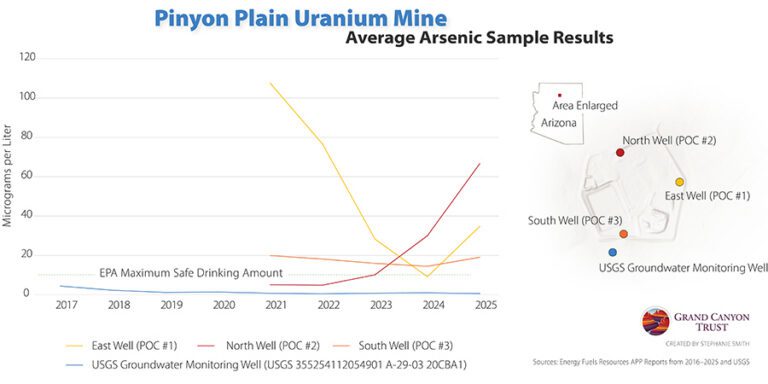
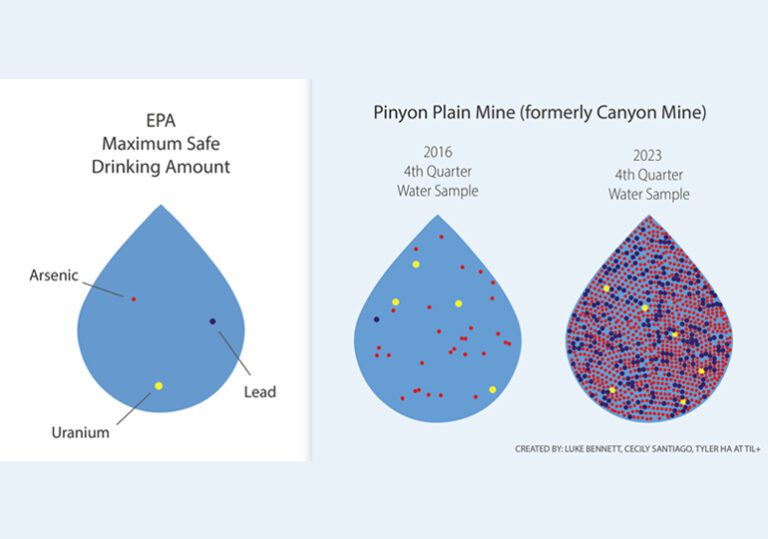
Rising arsenic levels in monitoring wells at Pinyon Plain uranium mine raise concerns about possible contamination of groundwater in the Grand Canyon region.
Opponents of Pinyon Plain Mine have a right to protest under the First Amendment, and the Grand Canyon Trust fully supports anyone who chooses to lawfully exercise that right.